Passive Direction Finding [DF] Techniques – Amplitude Comparison
In order to explain how the Amplitude Technique works it is important to understand that the antenna radiation pattern is equivalent to a spatial filter: it provides the angular discrimination of the incoming signal weighting its intensity with a different gain for each Angle of Arrival (AOA) as shown in Figure 1.
DOA is estimated by carrying out differential measurements that can be made:
- in the same pulse, between signals received at the same time by the beams of multiple antennas
- between signals received during time by multiple consecutive pulses between the positions assumed over time by
- the rotating beam of a single antenna (Figure 2)
- the scanning beam of a single antenna (“Sequential lobing”).
the measurement in case 1 above is called mono-pulse (Figure 3): several channels (“Gonio channels”), each associated with a Direction Finding (DF) Antenna , distributed in space to cover 360 ° az., provide simultaneous measurements (in the same pulse = mono-pulse ) of elementary parameters which, composed together with specific algorithms, allow the evaluation of the DOA.
Another type of measurement is also called mono-pulse but must not be confused with the previous one (it is frequently used in radar application for the so called mono-pulse tracking): it is carried out through the formation (at the antenna level) of the Amplitude/Phase differences (use of Array) and the use of 2/3 “physical” channels for processing of “Delta channels” and “Sum channel”.
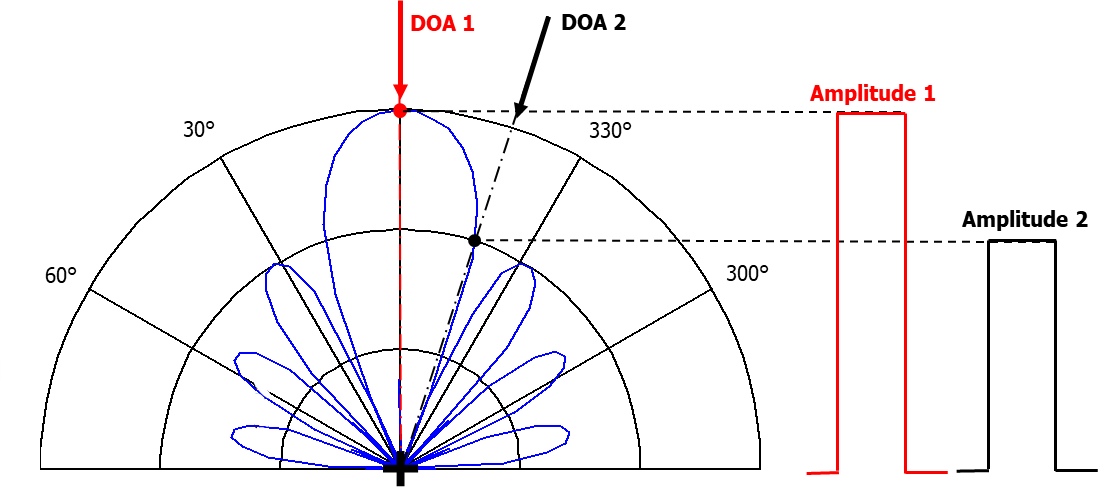
Figure 1: Weighting function of the beam of a directive antenna
By moving the beam width of the antenna it is possible to measure the emitter Angle of Arrival (AOA) from the instantaneous direction of the antenna main axis (Figure 2)
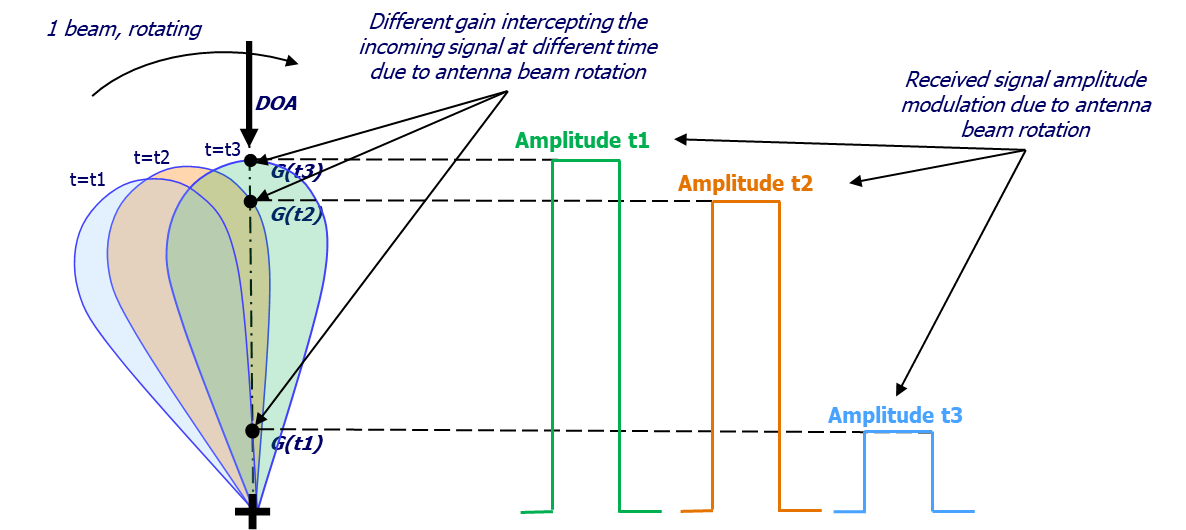
Figure 2: gain modulation due to antenna beam rotation
In an Amplitude Mono-pulse DF system (Figure 3) two or more squinted beams are provided in order to make available an instantaneous differential measurement for each emitter.
The accuracy of the AOA estimate is proportional to the antenna BW and to the amplitude unbalance between the channels up to the final amplitude detectors.
To improve the accuracy of an AM DF system it is necessary to increase the number of antennas and to reduce their beam width as well.
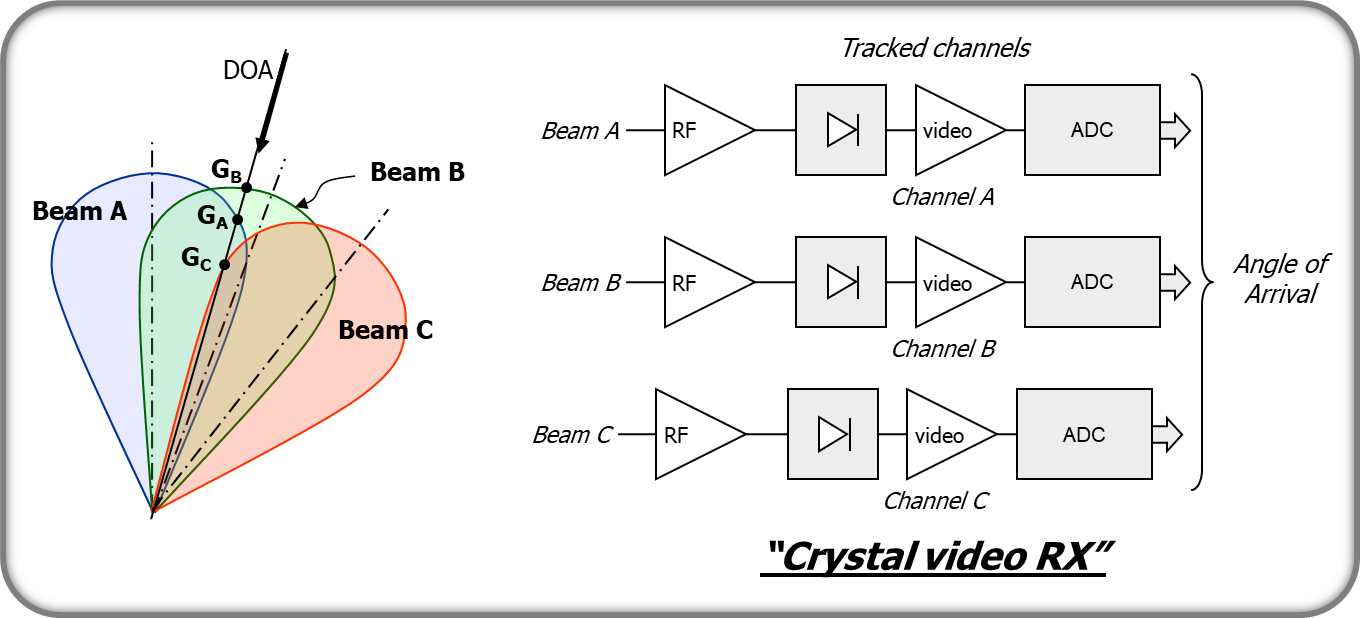
Figure 3: example of mono-pulse DF
Basic assumptions
Figure 4 shows the radiation pattern of a simple 2-Antennas system.

Figure 4: Normalized radiation patterns [polar representation]
The analytical expressions of the radiation patterns are:
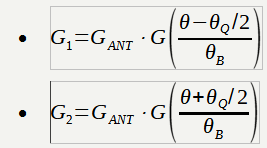
Where
 is the (voltage) peak gain of the Antenna
  is a generic function representing a unitary amplitude Radiation Pattern and a normalised beam-width (intended as -3 dB span);
- without any loss of generality
 could be any semi-definite positive function with following properties:
  must be a symmetric function,
  and
and 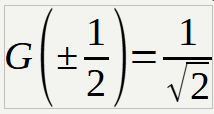 .
.
- without any loss of generality
 is the spacing of the 2 Antennas; in the present illustrating example Antennas are supposed to be centred in
  and
and  respectively in order to take the
  = 0° direction as a reference
- is a scale factor taking into account the so called beam-width of proper-3 dB
Derivation of the Algorithm
Assuming a signal coming to the ESM System’s antennas from an unknown direction ![]() , the amplitudes received on the 2 Antennas shall be related to it: the situation is shown in Figure 5.
, the amplitudes received on the 2 Antennas shall be related to it: the situation is shown in Figure 5.

Figure 5: Radiation patterns [Cartesian representation] and amplitudes received from a θ* direction
As it can be seen from Figure 5 the amplitudes received on two antennas are:
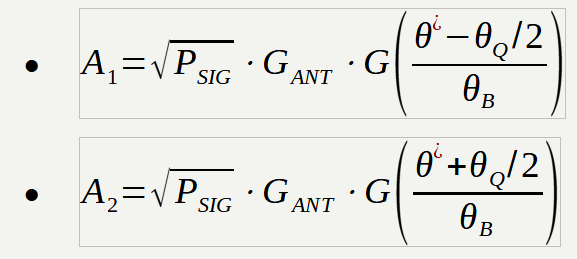
Where:
 is the (instantaneous) power of the incoming emission
 is the unknown DOA (Direction Of Arrival) to be estimated
The ratio between ![]() and
and ![]() is easily evaluated as:
is easily evaluated as:

As it can be seen ![]() is actually an implicit function of the unknown , of the function
is actually an implicit function of the unknown , of the function ![]() and
and ![]() of the parameters and
of the parameters and ![]() : the last three are known by design so should be theoretically possible – once measured the ratio
: the last three are known by design so should be theoretically possible – once measured the ratio ![]() – to achieve an estimate of
– to achieve an estimate of ![]() .
.
What is important now is to understand:
- How estimate the DOA
- How evaluate the sensitivity w.r.t. the Amplitude measurement
First of all we underline that in practical Receivers the ratio is actually substituted by the difference of logarithms (implicit in the dB scale) so – before explaining the algorithm – we should express ![]() and
and ![]() in dB:
in dB:
In last passage, we expressed signal’s power and Antenna Gain in dB and we used the identity

Now – in order to provide a general solution regardless a specific form of 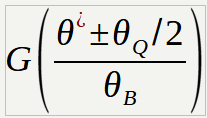 – we should act a Taylor series development for
 ![]()

Last passage is justified by the symmetry of the function ![]() .
.
Substituting in the expression of ![]() we get what follows:
we get what follows:
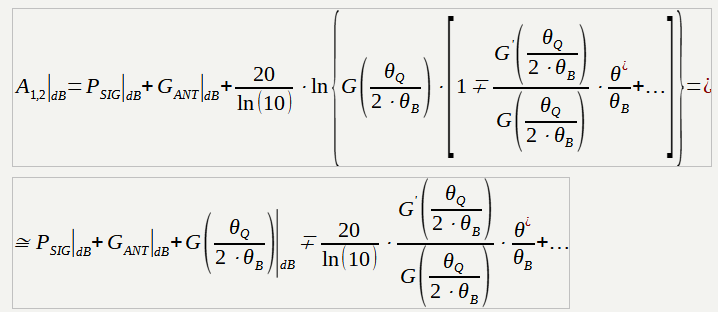
The last passage was justified by the approximation ![]() , which is allowed by the fact that is smaller than
, which is allowed by the fact that is smaller than ![]() which implies
which implies  .
.
Finally we get the following expressions for the amplitudes of the 2 Antennas once they have been converted in dB:


The above equations allow us evaluating the fundamental relationship of Amplitude comparison Technique

A simple DOA Estimator can be achieved as:
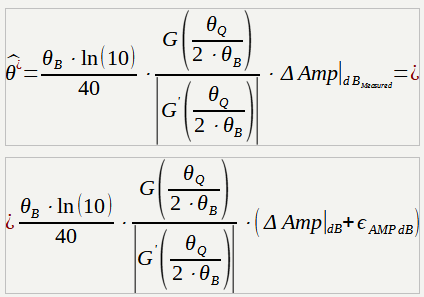
Where:
 is the measured Amplitude ratio in dB which differs
  from the actual one
 is the whole error in Amplitude.
DOA Estimation Performance
Since ![]() –
– ![]() being the DOA error – we can substitute what above in the estimator expression:
being the DOA error – we can substitute what above in the estimator expression:

Where
 is the generic kth component of the Amplitude error vector
 is the Mean Square sum of all Amplitude error components (assumed to be statistically independent)
A wide variety of DOA estimators does exist in practice: what presented here is just a possible one, however the estimator presented here is adequate to understand the main implications.
In particular, the term 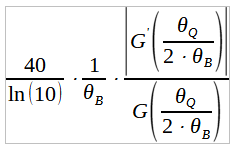 is often called “DF slope” because it express the Amplitude difference induced from a variation of the DOA: it can be shown (see [1] as example) that when
 ![]() (as in typical practical cases) the following approximation holds:
(as in typical practical cases) the following approximation holds:
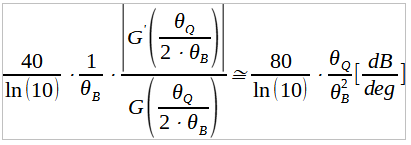
The DF Slope is one of the most important figure of merit: a DF Slope of – say – 0.4 dB/deg means that every degree induces an amplitude ratio variation of 0.4 dB, but this also tell us that 1 dB of amplitude measurement error causes 1/0.4 = 2.5° in the DOA estimation.
System level considerations
In what follows we report some considerations related to the employment of the Amplitude comparison Technique at EW “system level”.
- Signal Parameter
-
- DOA estimation is inferred through the Amplitude which is the basic signal parameter to be measured
- The quality of Amplitude measurement is strongly related to the desired performance: Super-Heterodyne Receivers [SHR] provides usually better performance with respect to Crystal Video Receivers [CVR] but both can be used.
- Also signal’s Frequency is typically measured and involved in the estimation process, for tuning/calibration purposes as it can be explained later
- Requirements/Issues on the EW System.
-
- Amplitude comparison Technique usually imposes the most stringent requirements on Antenna amplitude pattern specification. Whereas other techniques involving Phase/Time comparison (which in principle could operate also with omni-directional antennas) does not rely on the antenna amplitude shape.
- Additionally it has to be considered the Dynamic Range which has an impact on the performance.
-
-
- Number of Antennas:
-
-
-
-
- The number of antennas is the main “design driver” for the DOA performance, in fact the “DF slope” which is a key parameter strongly depend on it (see Table 1)
- The actual number of antennas to be used in an EW system is usually a trade-off arising between the best achievable performance and the installation constraints.
-
-
-
-
- Number of DF Channels:
-
-
- The number of DF Channels should be – from a conceptual point of view – the same of the Antennas, but in real world systems, the actual number of DF Channels could be different.
- In order to decrease the cost of the EW system a reduced number of channels could be employed by switching the Antennas toward the receivers: obviously, in this case it should be taken into account the additional cost due to the system management and the possible performance reduction. Clearly, this type of EW System is not monopulse, meaning that it cannot provide a DOA estimation on a single pulse.
-
-
- Calibration:
-
-
-
-
- Amplitude comparison Techniques – even if imposing the most severe constraints on the antenna’s shape – is usually less demanding, for the remaining part of the receiver, w.r.t. other techniques (as Phase of Time comparison.
-
-
-
-
- Synchronisation:
-
-
-
-
- Synchronisation too is usually much less demanding for Amplitude comparison Technique with respect to other techniques (e.g. Phase based) since the amplitude ratio between different antennas/channels is slowly varying.
-
-
-
-
- Kind of DF Channels:
-
-
-
-
- As above indicated the use of a specific type of channel can be preferred according to the wanted performance, but any kind of channel (SHR or CVR) able to provide amplitude information can be used;
- The best practice is that one of using logarithmic channels because of several reasons:
- (1) the ratio can be easily evaluated as difference of logarithms (as shown in the derivation of the algorithm);
- (2) Radar signals are constant-envelope (e.g. they do not have any amplitude modulation) so a logarithmic receiver does not produce any distortion;
- (3) EW Receivers can reach easier wide dynamic range when early stages are logarithmic.
-
-
- Typical DF performances
-
- In following Table 1 is reported the so-called “DF Slope” for different number of Antennas, some rough indication of performance is also provided.
- It must be underlined that performance ranges reported in table are the typical “rule-of-thumb” figures: a given EW System should to be assessed in term of performance with a dedicated study.
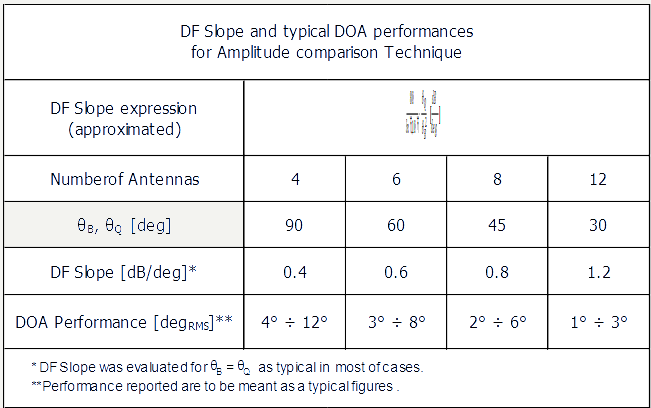
Table 1 – DF Slope & DOA performance vs number of Antennas.
- Pros
-
- Amplitude Technique is very versatile from a performance point of view:
- Radar Warning Systems [RWR] or light Electronic Support Measure [ESM] Systems can use it to reach adequate performance when a not too precise indication of the threat is required
- “Fine bearing” Systems (using a large number of antennas or equivalently a few number of antennas over a reduced angular sector) as well can use this Technique when high performances are needed.
- Amplitude Technique is very versatile from a performance point of view:
- “Impact on Platform”
-
- Since the mutual position of antennas does not matter (only the squint between their Bore-Sights) the impact on platform is typically the lowest.
- Most airborne RWR’s use Amplitude Techniques based on four antennas to cover the full 360° Azimuth.
Below two examples of six antenna DF goniometer, based on amplitude technique:
- an idealized representation of a six antennas amplitude Direction of Arrival installed on aircraft
- a picture of a ship Mast in which the DF amplitude section is highlighted

Figure 6: pictorial view of a 6 DF antennas installation in a wide body A/C

Figure 7: example of installation of a naval amplitude DF antenna set


